Pre-requisite
VSCode and Nodejs should be installed.
Introduction
In this blog, you will learn how to effectively use the debugger in detail inside VSCode itself and understand how the code flows with a simple example.
What is debugging?
- In simple words, debugging is the process of analyzing how your program runs.
- It is useful in locating and removing coding mistakes in computer programs.
What is a breakpoint?
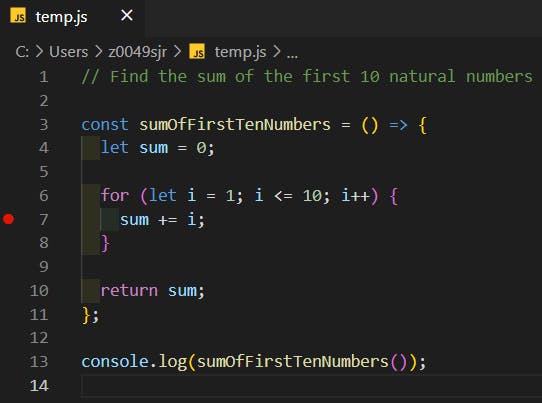
- A breakpoint is a point in the program where the code will stop executing. It is usually indicated by a solid red circle.
- For example,

Debugger in VSCode
- VSCode offers a toolbar of buttons for debugging code. This is how it looks:
 Continue || Step Over || Step Into || Step Out || Restart || Stop
Let us see the meaning and usage of each button in detail.
- Continue
- Usage: To continue debugging until the next breakpoint.
- Keyboard Shortcut: F5
- Step Over
- Usage: To debug the next line. (i.e. Shift the breakpoint to the next line)
- Keyboard Shortcut: F10
- Step Into
- Usage: If the line does not contain a function, it behaves the same as “Step Over”. But if it does, the debugger will enter the called function and continue line-by-line debugging there.
- Keyboard Shortcut: F11
- Step Out
- Usage: If the line is not inside a function, it behaves the same as “Step Over”. But if it does, the debugger will come out of the function and continue debugging.
- Keyboard Shortcut: Shift+F11
- Restart
- Usage: To restart debugging from beginning.
- Keyboard Shortcut: Ctrl+Shift+F5
- Stop
- Usage: To stop debugging.
- Keyboard Shortcut: Shift+F5
- Continue
How to use the debugger inside VSCode?
Open VSCode
Add breakpoint/s to your code. Example:
Click the "Run and Debug" icon on the sidebar (or Ctrl+Shift+D). This is how it will look.
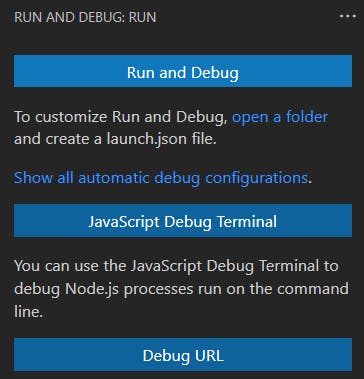
(One time procedure) Now, click on "Run and Debug" button. You will get a small popup to select the environment. This is how it will look.

Choose "Node.js"
Now, the "Run and Debug" sidebar would have 5 categories, namely Variables, Watch, Call Stack, Loaded Scripts, and Breakpoints. The debugging toolbar will also be present on top.
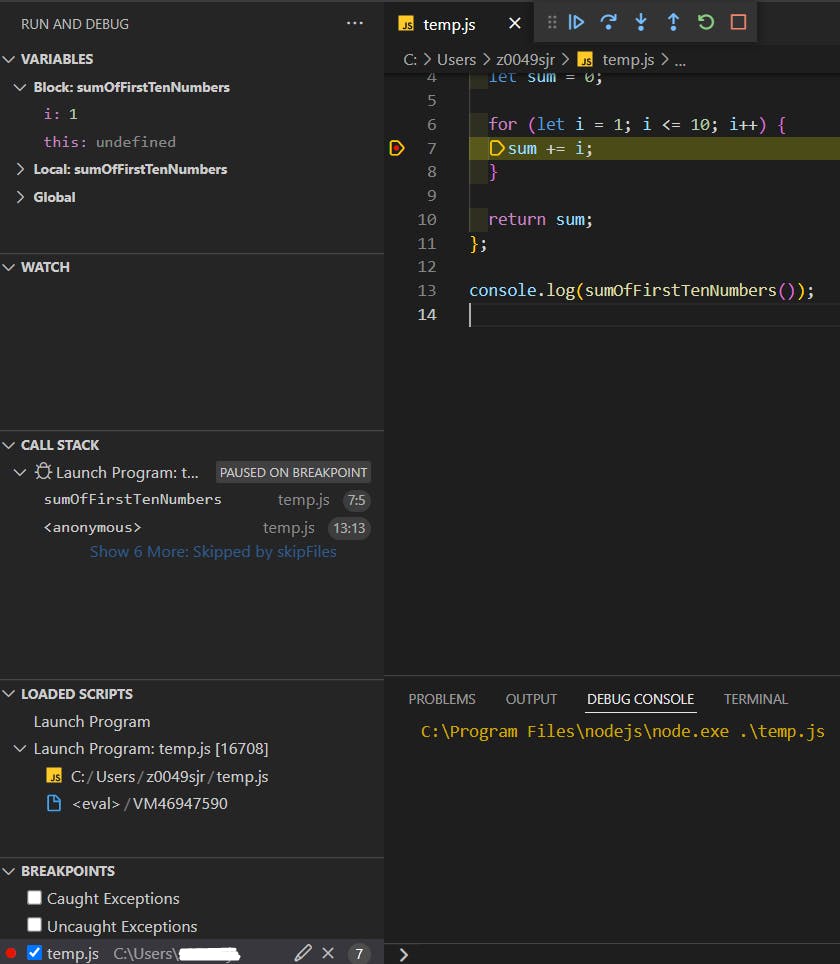
Understanding the different debugging options through a sample program
Example: We know that the breakpoint is placed on line 7. Here, i = 1 and sum = 0
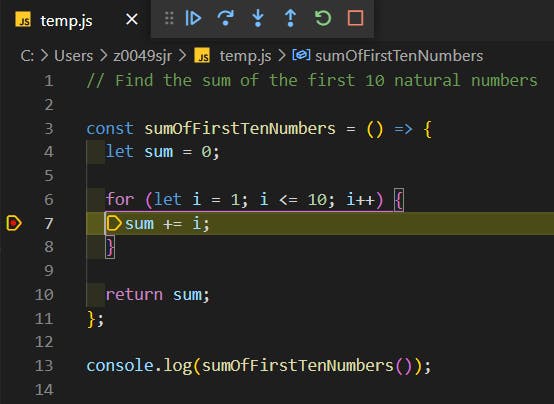
- When the continue button is clicked, the debugger executes one round of the loop and encounters the breakpoint again on line 7. But this time, i = 2 and sum = 1
- Now, when the step over button is clicked, the debugger executes one round of the loop and places the debugger on line 6. And this time, i = 3 and sum = 3
Assume that the breakpoint is placed on line 13.
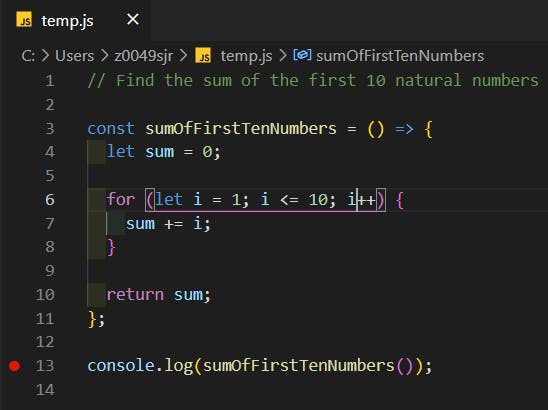
- When the step into button is clicked, the debugger will enter the function and sit on line 4.
- Now, when the step out button is clicked, the debugger will come out of the function and come back to wherever the function was called i.e. line 13
Conclusion
- We have now learnt how to debug a program using the various debugging options offered by VSCode.
- The main intent of debugging is to understand the code flow and see where errors/exceptions arise and rectify them accordingly.
- Hence, avoid using console.logs and use the debugger a lot more.
